


GCeasy
Universal Garbage collection log analysis tool. Tune and troubleshoot memory and GC problems.
Learn MoreTip: For quick results compress (*.zip, *.gz) and upload heap dump file
 (Introduction video)
Analyze heap dumps using REST API.
1. API End point:
https://heaphero.io/analyze-hd-api?apiKey={Add Your API_KEY}
2. Send an HTTP POST request to the endpoint with your heap dump file.
3. You'll receive a JSON response with the analysis results.
![]() See complete documentation here
See complete documentation here
Analyze heap dumps directly from remote locations by providing HTTP(S), AWS S3, or other remote URLs here (More details).

Due to inefficient programming, modern applications waste 30% to 70% of memory. HeapHero is the industry's first tool to detect the amount of wasted memory. It reports what lines of source code originating the memory wastage and solutions to fix them.

Android mobile applications can also suffer from memory leaks, which can be attributed to poor programming practices. Memory leaks in mobile apps bare direct consumer impact and dissatisfaction. Memory leak slows down the application's responsiveness, makes it hang or crashes the application entirely. It will leave an unpleasant and negative user experience.

A Memory leak is a type of resource drain that occurs when an application allocates memory and does not release after finish using it. This allocated memory can not be used for any other purpose and it remains wasted. As a consequence, Java applications will exhibit one or more of these non-desirable behaviors: poor response time, long JVM pauses, application hang, or even crash.

One common indication of a memory problem is the java.lang.OutOfMemoryError. This error is typically thrown when there is insufficient space to create a new object in the Java heap. There are 8 flavors of OutOfMemoryError. Each flavor of OutOfMemoryError has different causes and solutions.

Sometimes the latest version of an application might be consuming more memory than the previous version. You need to analyze what are the large objects residing in the memory? Where is it being created? Where is it being held up? Answers to all these questions can be found in Heap Hero's Heap Analysis Report.

Wrong data structure choice, created but unused data structure, overallocated and underutilized data structure, suboptimal data type usage (i.e., using 'long' instead of 'int'), data duplication - all these can easily waste 30 - 70% of your memory. Heap Hero's intelligence report helps eliminate these memory hogs.


HPROF is a simple command-line tool that captures CPU/Heap profiles to identify performance bottlenecks in applications. By default, this tool writes the captured profiles to a file with '.hprof ' extension. HPROF file may contain CPU usage, heap allocation statistics, heap dump, thread stack traces and monitor states. It can be either in binary or text format. Heap Hero is a powerful tool to view and analyze HPROF files.

Heap Hero, a universal tool that will parse and analyze heaps dumps written in any language that runs on the JVM. It will convert Java, Scala, Jython, JRuby heap dumps to useful information to optimize your memory usage.

Reliably and quickly fix your memory problems through a precision single-page view of your heap dumps. View intuitive data display of heap histogram, largest objects, and memory leak suspects with a concisely brilliant interface.

Our award-winning heap dump analysis tool is offered as a free service. Our tools help you to fix memory leaks, OutOfMemoryError, memory regression, memory hogs and any memory-related problems. All this power at your fingertip for free.

Android is the world's largest mobile platform. Heap Hero can parse and analyze the heap dumps generated from any Android devices. Heap Hero's deep learning algorithms can report memory leak suspects and objects wasting memory.

Heap Hero is the world's first and the only cloud-based heap dump analysis tool. Registration, download, or installation is not required to use the tool. Just upload your application's heap dumps & review the beautiful reports instantly.
Heap Hero has built the industry's first and only REST
API to analyze heap dumps. Stop manually uploading
and
analyzing heap dumps. Instead, analyze heap
dumps from
all your JVMs and Android devices in a
programmatic
manner through HEAP HERO's REST API.
Our award-winning deep learning algorithms have the
intelligence to detect memory leaks and isolate the
objects that are causing the memory leaks. Save time
spent on diagnosing the memory leaks. It's all done
automatically.
Heap Dump files consume a lot of disk space, making
it
very hard to share and collaborate with the team.
HeapHero provides shareable URL links to heap dump
analysis reports, making it a breeze to share and
collaborate heap dump analysis with your fellow
engineers.

Analyzing heap dump doesn't have to be a tedious job. it can be fun, and it can be 'wow'.
Optimize Memory
Memory Hogs
OutOfMemory Error
Detect Memory Leak
We have optimized hundreds of open source and enterprise applications. Please take advantage of our battle-fought experience. We can either come on-site or provide remote consulting services.
Our easy to understand, fun-filled, on-site training programs are a preferred choice for several enterprises to transform thier engineers into performance experts.

Are you looking to port your application to the AWS cloud? Are you following the AWS best practices? Are looking to lower your AWS bills? We are here to help you.
Instructor: Ram Lakshmanan, Architect of GCeasy
9 hours of video series with case studies and real life examples
3 months yCrash tool subscription
e-books and study material to complete this course
LinkedIn shareable certificate
1 year course subscription
Attended by engineers from all over the world from the premier brands

Highlighting engineers certified in diagnosing and
optimizing applications.

With over 21 years of professional experience, Kris Murray is currently employed full-time at CloudBees as a Development Support Engineer.

Have 18+ years of experience in Telecom and Insurance domain and worked on Java/J2EE, Hybrid Android

Specialties: Agile, SCRUM , Product manager, Portfolio manager, Technical Account Manager (TAM), Collection & Recoveries

Universal Garbage collection log analysis tool. Tune and troubleshoot memory and GC problems.
Learn More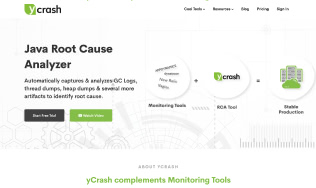
Automatically captures & analyzes GC Logs, thread dumps, heap dumps & several more artifacts to identify root cause.
Learn More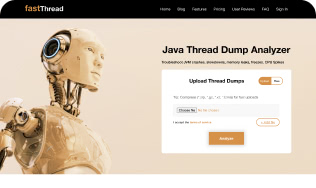
Machine learning algorithms aided tool to analyze the thread dumps, core dumps, and also hs_err_pid dumps.
Learn More
Parses Unix/Linux/solaris,..etc 'top' command output & generates an intuitive report to optimize the performance.
Learn More
Simulates performance problems like Memory Leak, OutOfMemoryError, CPU spike, StackOverflowError etc.
Learn MoreJava GC Tuning is made to appear as rocket science, but it's a common sense!
If there are questions that you are looking for, please contact us at support@tier1app.com